If you’re in the crane industry, then it’s highly likely that you already know that overkill or down renting is an industry-wide issue. You book a job that only needs a 40-ton crane, but on the day of the lift, none of your 40-tons are available. Inevitably, you have to send a bigger crane but still only bill for a 40-ton, which cuts into your profit margins. But, do you know how much that is costing you every year?
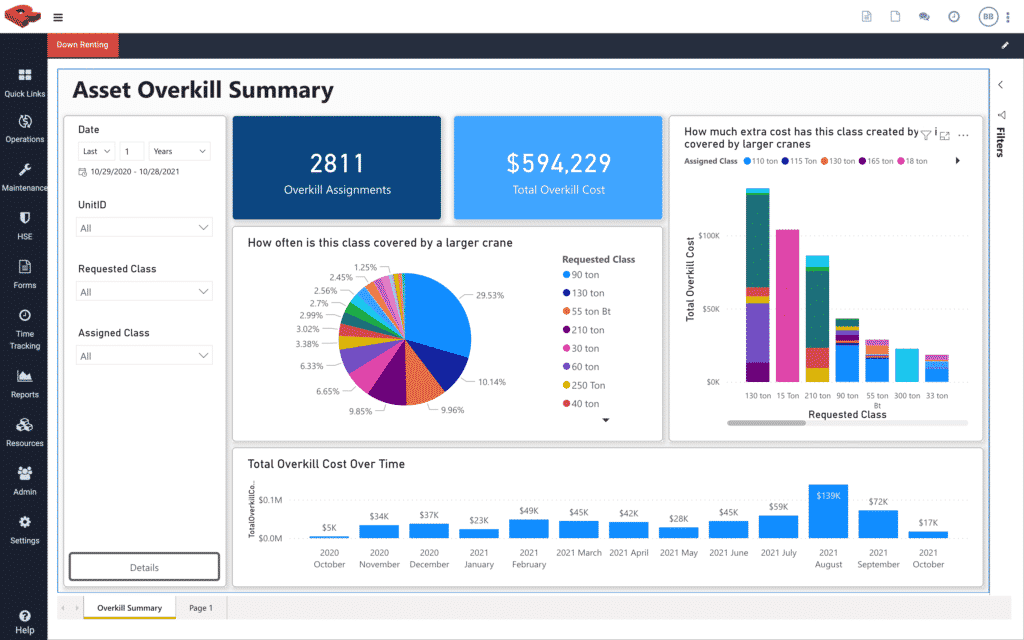
For one crane company, they incurred almost $600,000 in overkill costs in one year.
So, you know it’s a problem and an expensive one at that. Yet, solving your down renting issue can be more complicated to put into action. An overkill or down renting report is the first step, but it requires either manual data entry and spreadsheets or an integrated software system that handles it for you with no extra work.

What is an Overkill or Down Renting Report?
The ultimate purpose of a down renting report is to provide you with the information needed for crane purchasing decisions. However, we recommend going deeper into the issue with a root cause analysis. Identifying the root cause of your down renting is the key component to eliminating overkill costs. In some cases, it’s not an inventory issue. Instead, your down renting for a certain crane class may be due to aging assets or out-of-service maintenance issues.
How to Identify the Root Cause of Overkill Costs
The first thing you need is an easy way to analyze your report. With Redlist, you get a user-friendly dashboard that provides a few different ways to look at your data. We recommend starting with the pie chart that shows the percentage of overkill for each crane class.
Here’s an example to walk you through it:
You open your overkill or down renting dashboard in Redlist and pick the biggest piece of the pie chart. It says your 90-ton cranes are the source of 30% of your total overkill costs. Should you go out and buy another 90-ton crane? Not exactly. You need to dive deeper into your data with a second chart that cross-references your 90-tons with your other crane classes. This chart will show where each crane class is spending its time. You may discover the real reason your 90-tons aren’t available is that they’re often covering your 40-ton jobs.
Next, you’ll move down this cross-reference chart to check your 40-ton cranes. Are they covering for a smaller crane class? Or are they having recurring mechanical issues that take them out of commission? For this example, let’s say your 40-tons are experiencing a maintenance issue. Switch over to your maintenance history report provided by Redlist and check what the problem seems to be. Is it an aging asset, or is it just in need of more routine maintenance, lubrication, or a higher-quality part? If it’s a maintenance issue that can be improved with a better maintenance plan or inventory change, you can make that decision and monitor these reports for improvement.
The final step: If it’s a matter of an aging asset, you can head over to your total cost of ownership report and pull up that asset. Your total cost of ownership for that 40-ton crane includes the cost of repairs, but also the overkill costs you’re racking up by having your 90-ton cranes cover for 40-ton jobs. If you replace the aging 40-ton crane, you will eliminate the repair and down renting costs and reduce your total cost of ownership.
It isn’t just about purchasing decisions anymore with these Redlist reports. You get the full picture of your down renting costs and the root cause, as well as maintenance history and total cost of ownership. With no extra work to create the reports, you can identify the root cause to reduce and eliminate your overkill expense.


